A fundamental part of the work in economic research consists of estimating relationships between variables. A good starting point is to use reduced forms of well-established models in the literature. For example, to analyze the effect of a certain variable on economic activity, we can use a specification derived from the IS curve. Similarly, we can use (a variation of) the Phillips Curve to measure the impact of a certain variable on inflation.
In this section, we’ll see how to estimate the parameters of a simple reduced form Phillips Curve, check basic properties of the model and extract some useful information from it. It’s worth noting that the same procedures applies to any other custom model.
For this exercise, we’ll use seasonally-adjusted quarterly data from the Brazilian economy ranging from 2004Q1 to 2022Q4. The basic Phillips Curve can assume the following form:
\[ \pi_t = \beta_1\pi_{t-1} + \beta_2\pi^{e}_{t,t+4|t} + \beta_3\Delta e_{t-1} + \beta_4\tilde{y}_{t-1} + \epsilon_t \] where \(\pi_t\) is a measure of inflation; \(\pi^{e}_{t,t+4|t}\) is the expected inflation in \(t\) for \(t+4\); \(e\) is a measure of exchange rate or imported inflation; and \(\tilde{y}\) is a measure of output gap. In this exercise, \(\pi_t\) is a measure of core inflation which excludes food-at-home and regulated prices (CPI_CORE); \(\pi^{e}\) is the market expectations compiled by the Brazilian Central Bank (CPI_EXP); \(e\) is an index of commodities prices in USD (CI_USD); and \(\tilde{y}\) is the cycle component obtained from the HP Filter on the GDP series (YGAP).
Let’s start by importing the data set and visualizing the variables of interest.
Next, we need to create the appropriate variables for lagged CPI and YGAP and the percentage change of CI_USD. Then, we fit the model to the data. Note that we are imposing no restrictions on the coefficients at this point, although the structural version of the Phillips curve does (we’ll see how to do so in the next section). In addition, we are using OLS to estimate the coefficients, although an endogeneity-robust method such as the Generalized Method of Moments (GMM) is more suitable.
Call:
lm(formula = CPI_CORE ~ CPI_CORE_lag + CPI_EXP + YGAP_lag + dlog_CI_USD -
    1, data = cp_reg_data)

Residuals:
     Min       1Q   Median       3Q      Max
-0.79874 -0.19115 -0.03149  0.16141  0.85059

Coefficients:
             Estimate Std. Error t value Pr(>|t|)
CPI_CORE_lag 0.656741   0.092798   7.077 8.48e-10 ***
CPI_EXP      0.089305   0.026820   3.330 0.001381 **
YGAP_lag     0.031710   0.011866   2.672 0.009339 **
dlog_CI_USD  0.017335   0.004462   3.885 0.000227 ***
---
Signif. codes:  0 '***' 0.001 '**' 0.01 '*' 0.05 '.' 0.1 ' ' 1

Residual standard error: 0.3169 on 71 degrees of freedom
  (1 observation deleted due to missingness)
Multiple R-squared:  0.9551,    Adjusted R-squared:  0.9526
F-statistic: 377.6 on 4 and 71 DF,  p-value: < 2.2e-16
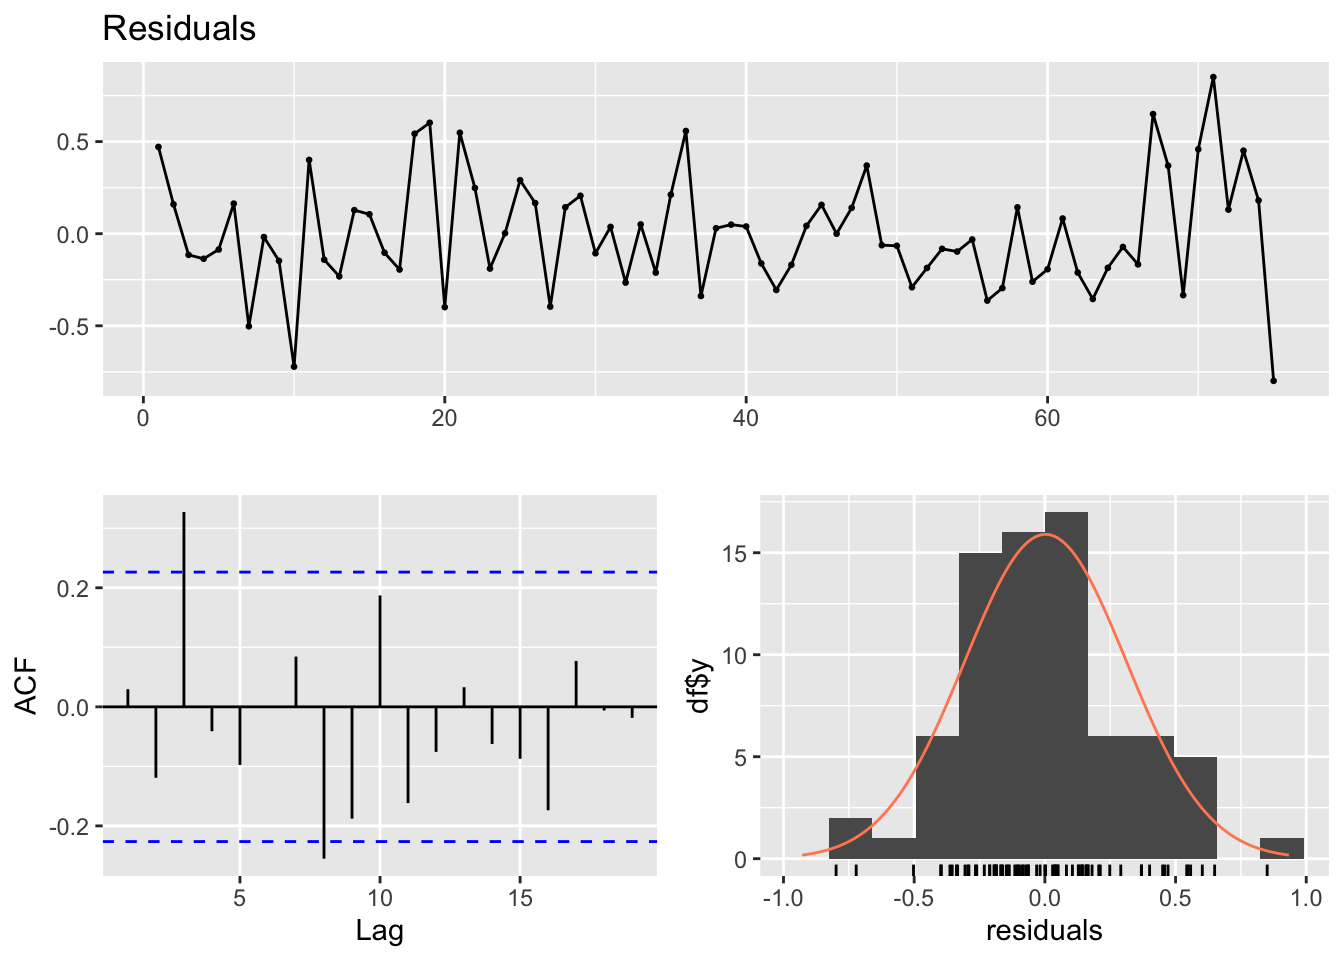
The coefficients are highly significant and show the expected signs. To check the model validity, it’s crucial that the residuals are zero-mean and exhibit no clear trend. The checkresiduals functions from the forecast package provides a handy summary of the model residuals.
forecast::checkresiduals(cp_fit)
    Breusch-Godfrey test for serial correlation of order up to 10

data:  Residuals
LM test = 24.948, df = 10, p-value = 0.005445
Figure 10.2: Phillips Curve Model Residuals
We can see that the residuals are well-behaved: mean around zero, no outliers and no clear trend. There is an autocorrelation signal in the third lag evidenced by the ACF, but given that it is relatively small and far enough away, I believe it can be overlooked.
After confirming the validity of the model, we can use it for various purposes. The estimated coefficients provide interesting rules of thumb for everyday use. For example, the dlog_CI_USD coefficient measures the pass-through from imported prices to inflation. According to the model, a 10% increase in imported prices adds 0.17p.p to inflation in the current quarter.
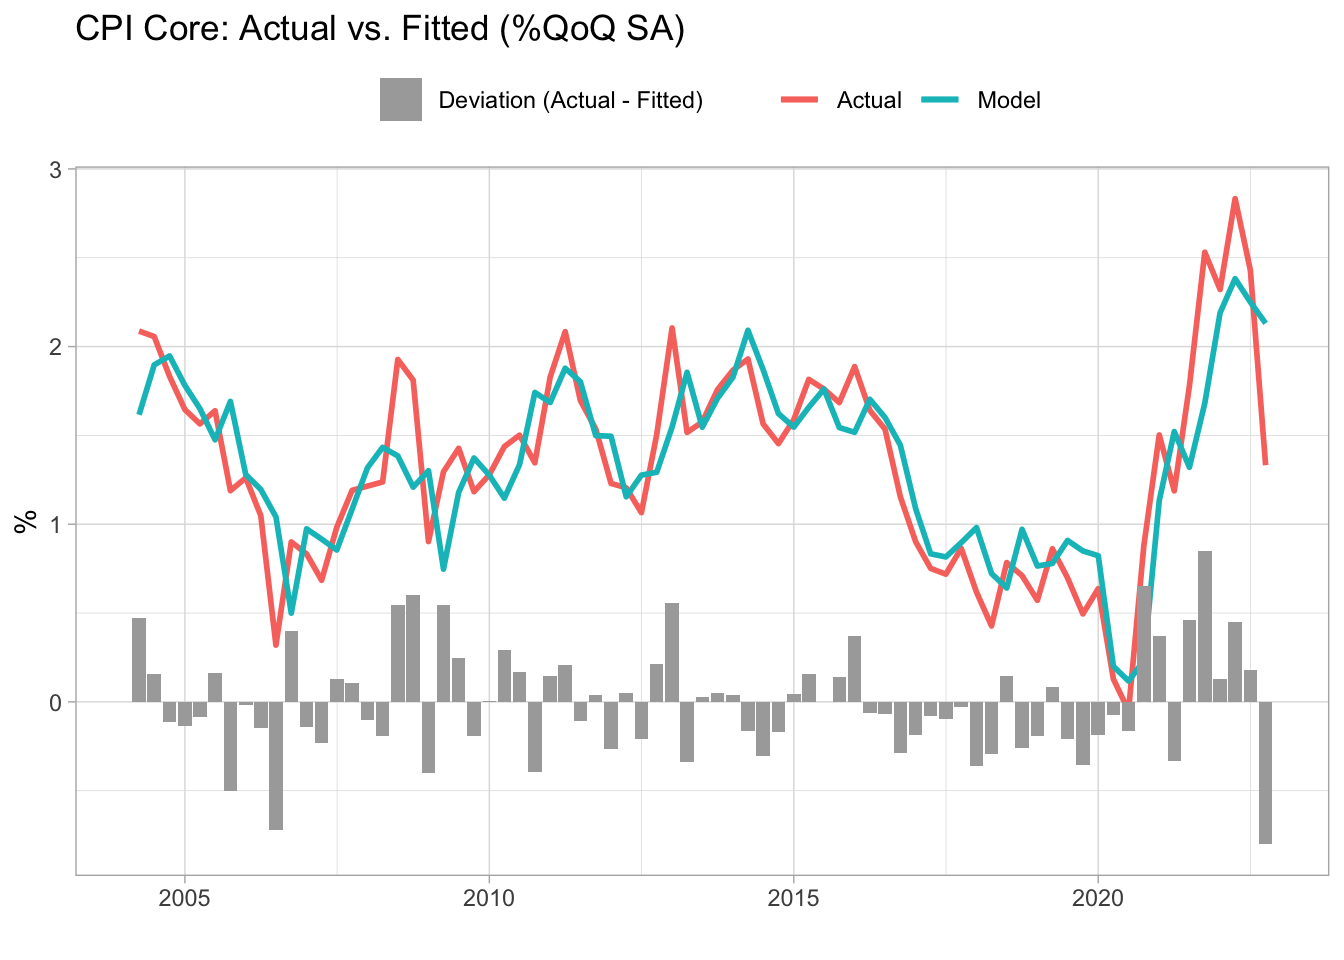
Plotting the model fit is a good way to check deviations of the target variable from its fundamentals (at least those that are taken into account in the model). We can use the augment function from the broom package, which returns a data frame with the fitted values, residuals, etc. The broom package also provides other functions that greatly facilitate the manipulation of the regression results, as we’ll see later.
Figure 10.3: Phillips Curve - Actual vs. fitted values
What is the role of economic activity in inflation in recent quarters? What about external factors, have they played a significant role in the overall result? It’s a common practice to quantify the contribution of each variable to the observed value in a given period. This kind of decomposition is obtained by multiplying the value of each variable in the period by the respective model coefficient.
This time, we can make use of the tidy function from the broom package which returns the model’s coefficients in tidy format.
cp_decomp <- cp_fit_plot %>%select(date, names(cp_fit$coefficients)) %>%pivot_longer(-date, names_to ='term', values_to ='value') %>%left_join( cp_fit %>% broom::tidy() %>%select(term, estimate) ) %>%mutate(contribution = value*estimate) %>%bind_rows( cp_fit_plot %>%select(date, contribution = .resid) %>%mutate(term ='residual') )cp_decomp %>%ggplot(aes(x = date)) +geom_col(aes(y = contribution, fill = term)) +theme_light() +scale_fill_brewer(type ='qual', palette =6) +labs(title ='Contribution of each variable to Core CPI (p.p)',x ='', y ='', fill ='Variable' )
Figure 10.4: Contribution of each variable to Core CPI (p.p)
We can see that inertia and expectations are the main drivers of inflation throughout the sample, although for specific periods economic activity and imported inflation played a significant role. I also included the residual term because it’s also important to know when factors other than those incorporated into the model are relevant to the outcome and the magnitude of its contribution to the overall result.
Obviously, the model can be used to produce forecasts. For this, we need to provide values for the exogenous variables including the lagged CPI. In the next section we’ll see a more complete approach on how to provide scenarios for future values. For now, I’ll only take the last value of each variable and add a small random variation.